Data visualization is a crucial aspect of conveying complex information in a simple, understandable format. With advancements in technology, artificial intelligence (AI) has made it easier than ever to create professional charts and graphs. Choosing the best AI tool to create charts and graphs can significantly enhance your ability to communicate data-driven insights. In this article, we will explore some top AI tools for chart and graph creation.
Tableau
Tableau stands out as a top-tier analytics platform designed for professionals and enterprises. Known for its ability to connect to a wide range of data sources, Tableau uses AI to analyze datasets, suggest visualizations, and uncover hidden patterns. Its “Ask Data” feature, which allows users to type questions in natural language, sets it apart for those looking to streamline complex analyses into intuitive visuals.

How to Use
- Import Data:
- Connect to your data source, such as Excel, Google Sheets, or SQL databases.
- Select the relevant tables or datasets for analysis.
- Create Charts:
- Drag and drop fields (e.g., “Sales” and “Region”) onto the Rows and Columns shelves.
- Tableau suggests the best chart types (e.g., bar charts, scatter plots) based on your data.
- Use AI Features:
- Go to the “Ask Data” tab and type a natural language query, such as “Show total sales by region.”
- Tableau generates a visual response that you can further customize.
- Customize Visuals:
- Add filters, colors, and labels to enhance your chart.
- Combine multiple charts into a dashboard for a comprehensive view.
Key Features
- AI-Powered Suggestions: Automatically identifies patterns and trends.
- Wide Chart Selection: Includes bar charts, scatter plots, and dashboards.
- Seamless Integration: Connects with multiple databases and cloud platforms.
Limitations
- High cost for premium features.
- Steeper learning curve for new users.
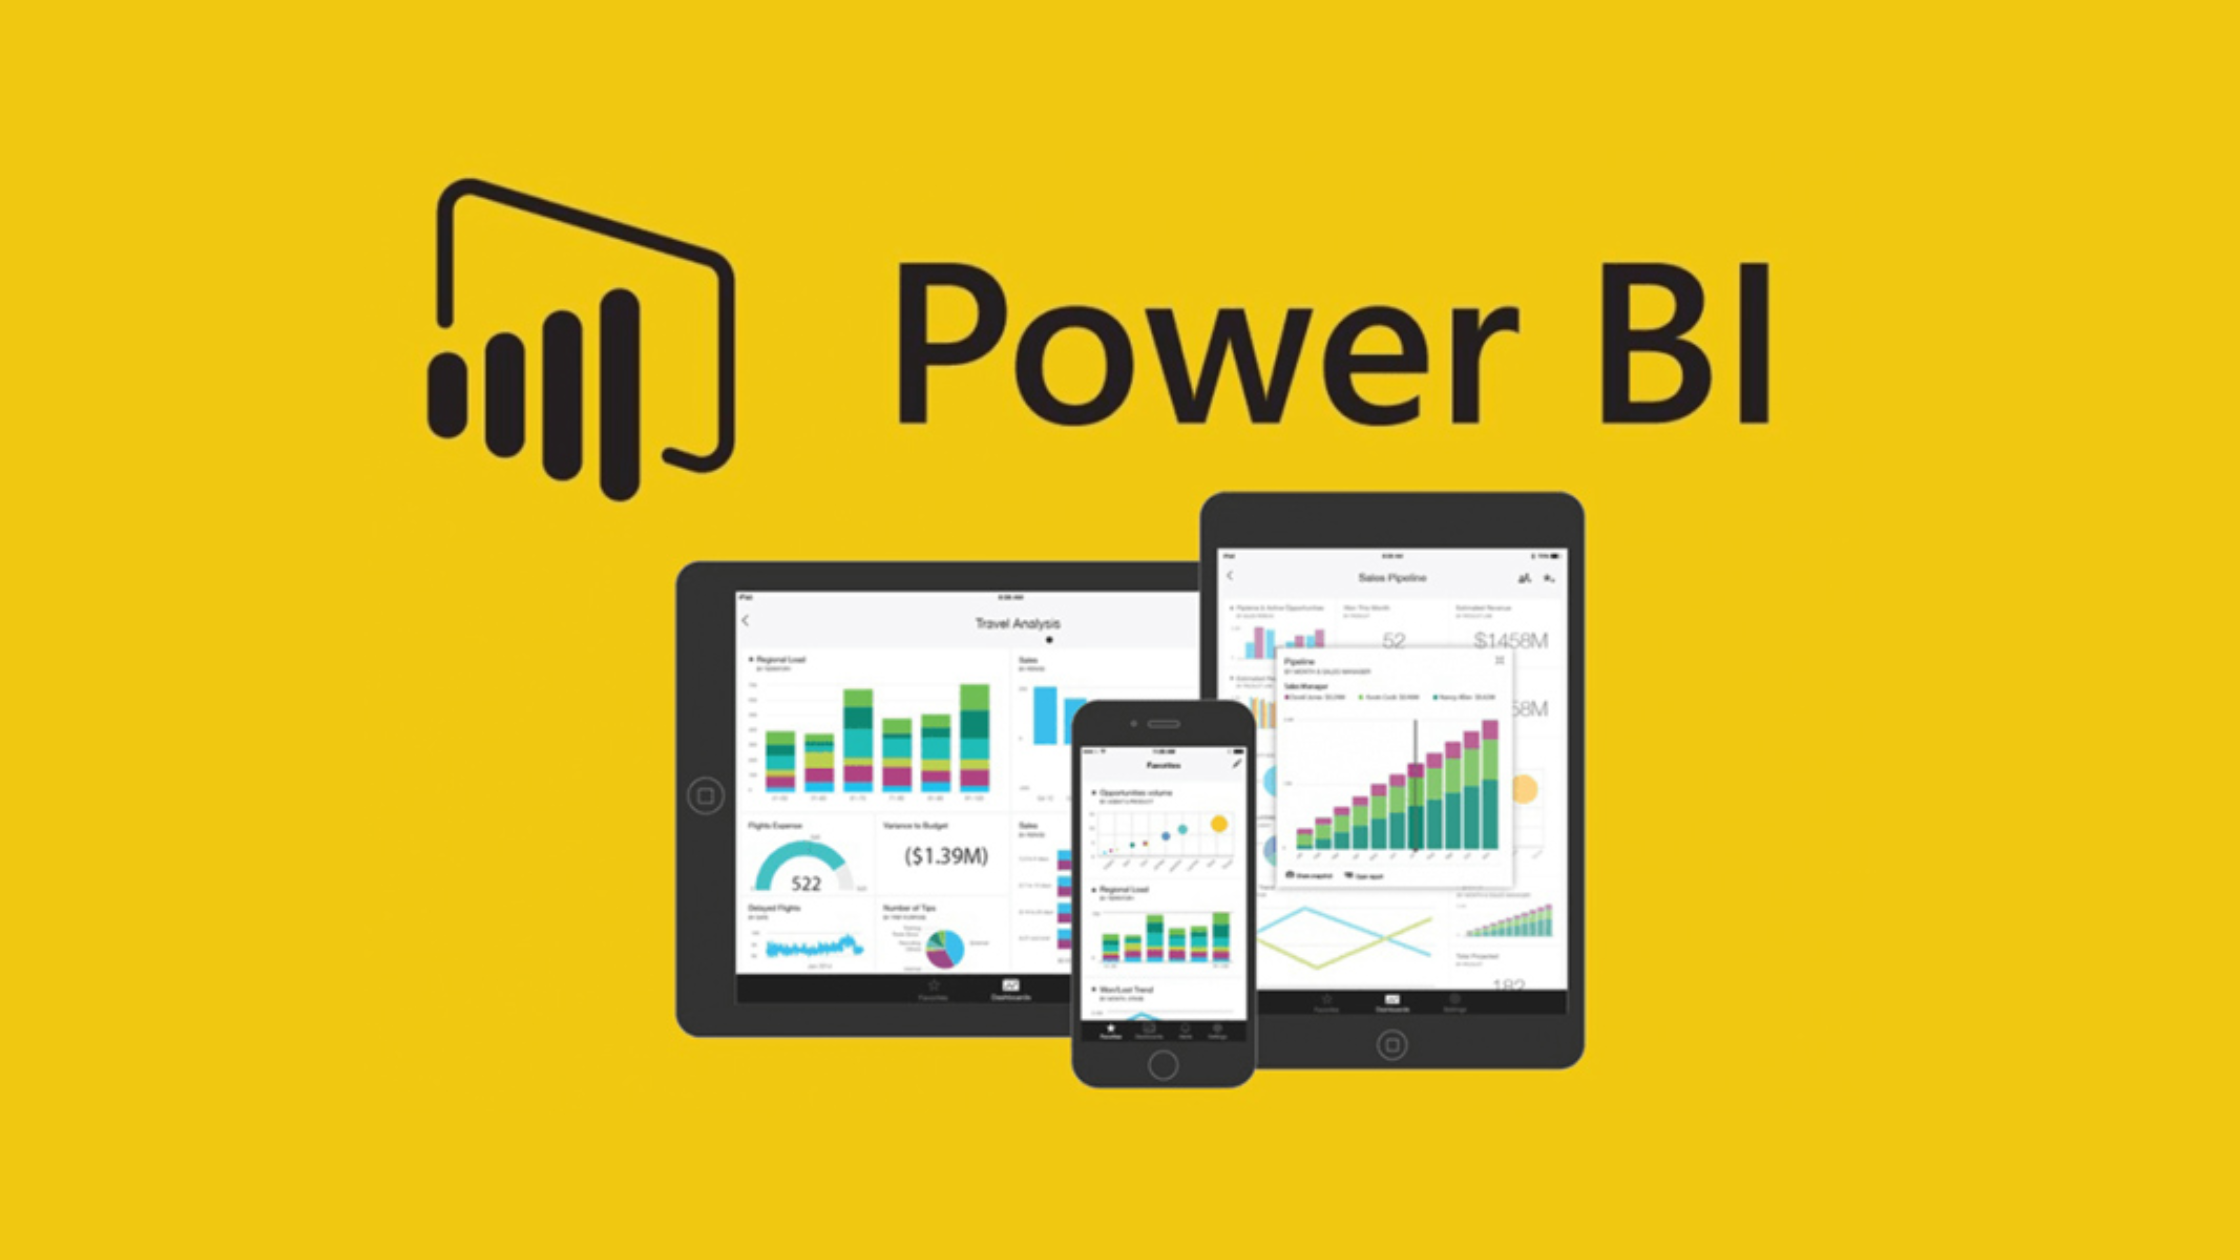
Microsoft Power BI
Microsoft Power BI combines AI-driven analytics with an emphasis on interactivity. Its integration with Microsoft’s ecosystem, including Excel and Azure, makes it a favorite among business users. Power BI’s real-time data updates, paired with its Q&A feature, help users create dynamic charts and dashboards effortlessly. It’s especially well-suited for teams looking for collaborative visualization solutions.
How to Use
- Connect Data Sources:
- Import data from Excel, Azure, or APIs.
- Set up live connections for real-time updates if needed.
- Generate Visuals:
- Use the “Visualization Pane” to select a chart type.
- Drag and drop fields into the “Values,” “Axis,” or “Legend” sections to populate your chart.
- Leverage AI Features:
- Click on the Q&A icon and type questions like “What are the top-performing products?”
- Power BI automatically generates charts based on your query.
- Refine Your Visuals:
- Use the “Format” option to tweak chart elements, colors, and tooltips.
- Pin visuals to a dashboard for easy access.
Key Features
- Real-Time Dashboards: Provides live updates for ongoing data streams.
- AI Recommendations: Suggests the best chart type based on your data.
- Collaboration Tools: Enables sharing across your organization.
Limitations
- Advanced features require technical expertise.
- Performance issues with very large datasets.
ChartGPT
ChartGPT is a lightweight and user-friendly AI tool tailored for quick visualization needs. By simply describing your data or the desired chart type in plain language, users can generate polished visuals without diving into technical complexities. This tool is perfect for individuals or teams who need simple, fast, and effective charts for presentations or reports.

How to Use
- Input Data:
- Upload a dataset (e.g., a CSV file).
- Alternatively, describe your data in text, such as “Monthly sales from January to December.”
- Generate Charts:
- Enter a prompt like “Create a bar chart for monthly sales.”
- ChartGPT processes the input and creates the requested chart.
- Edit and Download:
- Adjust chart elements (e.g., titles, colors, or axis labels).
- Export the chart in your desired format (PNG, SVG, etc.).
Key Features
- Prompt-Based Creation: Visualizations created directly from your descriptions.
- Speed and Ease: Ideal for non-technical users needing quick results.
- Supports Various Chart Types: Covers bar charts, line graphs, and pie charts.
Limitations
- Limited advanced customization options.
- Struggles with complex or massive datasets.
Google Looker Studio
For those immersed in the Google ecosystem, Google Looker Studio offers a free, AI-powered platform for creating interactive reports and dashboards. Its ability to connect seamlessly with Google Sheets, Analytics, and BigQuery makes it a natural choice for small businesses and individuals. AI-enhanced recommendations for chart types and easy sharing options make it a valuable tool for collaboration.
How to Use
- Connect to Data:
- Choose a data source like Google Sheets, BigQuery, or Google Analytics.
- Authorize access to allow data synchronization.
- Build Visuals:
- Use the “Add a Chart” option to select from bar charts, pie charts, scatter plots, and more.
- Drag and drop dimensions (e.g., “Date”) and metrics (e.g., “Revenue”) to populate the chart.
- AI Recommendations:
- Looker Studio suggests the most suitable chart types based on your data.
- Use filters and controls to refine data visualizations.
- Design the Report:
- Combine multiple charts into a cohesive report.
- Share the interactive report link with your team or export it as a PDF.
Key Features
- AI-Powered Suggestions: Automatically recommends visualization types.
- Google Ecosystem Compatibility: Seamless integration with Google products.
- Free to Use: Accessible to individuals and small businesses.
Limitations
- Limited features compared to premium tools.
- Dependence on Google tools for full functionality.
Zoho Analytics
Zoho Analytics caters to businesses seeking deep insights with minimal effort. Its AI assistant, Zia, takes the user experience to the next level by providing instant recommendations for charts and graphs based on natural language queries. Zoho Analytics is an excellent choice for organizations already using other Zoho applications, offering integration and advanced customization options.
How to Use
- Import Data:
- Connect to Zoho apps, cloud storage, or external databases.
- Upload datasets in supported formats like Excel or CSV.
- Create Visualizations:
- Use the “Visualize” tab to explore chart options.
- Drag and drop fields to generate visuals manually or let Zia suggest charts.
- Ask Zia (AI Assistant):
- Type queries like “Show sales growth by quarter.”
- Zia analyzes the data and presents visualizations instantly.
- Customize and Share:
- Modify chart styles, add filters, or group data for clarity.
- Share dashboards or embed them into websites.
Key Features
- AI Insights: Zia highlights patterns and creates charts automatically.
- Interactive Dashboards: Combine multiple charts for an in-depth view.
- Cross-Platform Integration: Works with other Zoho applications and external tools.
Limitations
- Cluttered interface for beginners.
- Limited customization compared to more advanced visualization tools.
Conclusion
AI-powered tools like Tableau, Power BI, and ChartGPT are revolutionizing data visualization. Whether you are looking for simplicity, advanced analytics, or seamless integrations, choosing the best AI tool to create charts and graphs depends on your needs and technical expertise. By leveraging AI, these tools save time, improve accuracy, and make data storytelling accessible to all.
About Herond Browser

Herond Browser is a Web browser that prioritizes users’ privacy by blocking ads and cookie trackers, while offering fast browsing speed and low bandwidth consumption. Herond Browser features two built-in key products:
- Herond Shield: an adblock and privacy protection tool;
- Herond Wallet: a multi-chain, non-custodial social wallet.
Herond aims at becoming the ultimate Web 3.0 solution, heading towards the future of mass adoption. Herond has now released the mobile version on CH Play and App Store. Join our Community!


