

Technical analysis is a methodology used by traders and investors to forecast future price movements of financial assets by analyzing past market data, primarily focusing on price and volume. Especially in Crypto Trading, technical analysis is becoming more popular because it helps the traders to make right decisions to minimize risks for them. This article aims to give you a brief understanding of definition and roles of technical analysis.
What is Technical Analysis in Crypto Trading?
Technical analysis in crypto trading involves the study of historical price data and market statistics of cryptocurrencies to make informed trading decisions. In more detail, it focuses on analyzing patterns, trends, chart formations, and various technical indicators to forecast future price movements and identify trading opportunities.

Key Technical Indicators for Crypto Analysis
Technical indicators can be used individually or in combination to analyze cryptocurrency price movements and make informed trading decisions. Let’s discover some key technical indicators in Crypto!
Moving Averages (MA)
Moving averages smooth out price data to identify trends. For instance, traders often use the crossover of short-term (e.g., 50-day) and long-term (e.g., 200-day) moving averages to signal bullish or bearish trends.
Relative Strength Index (RSI)
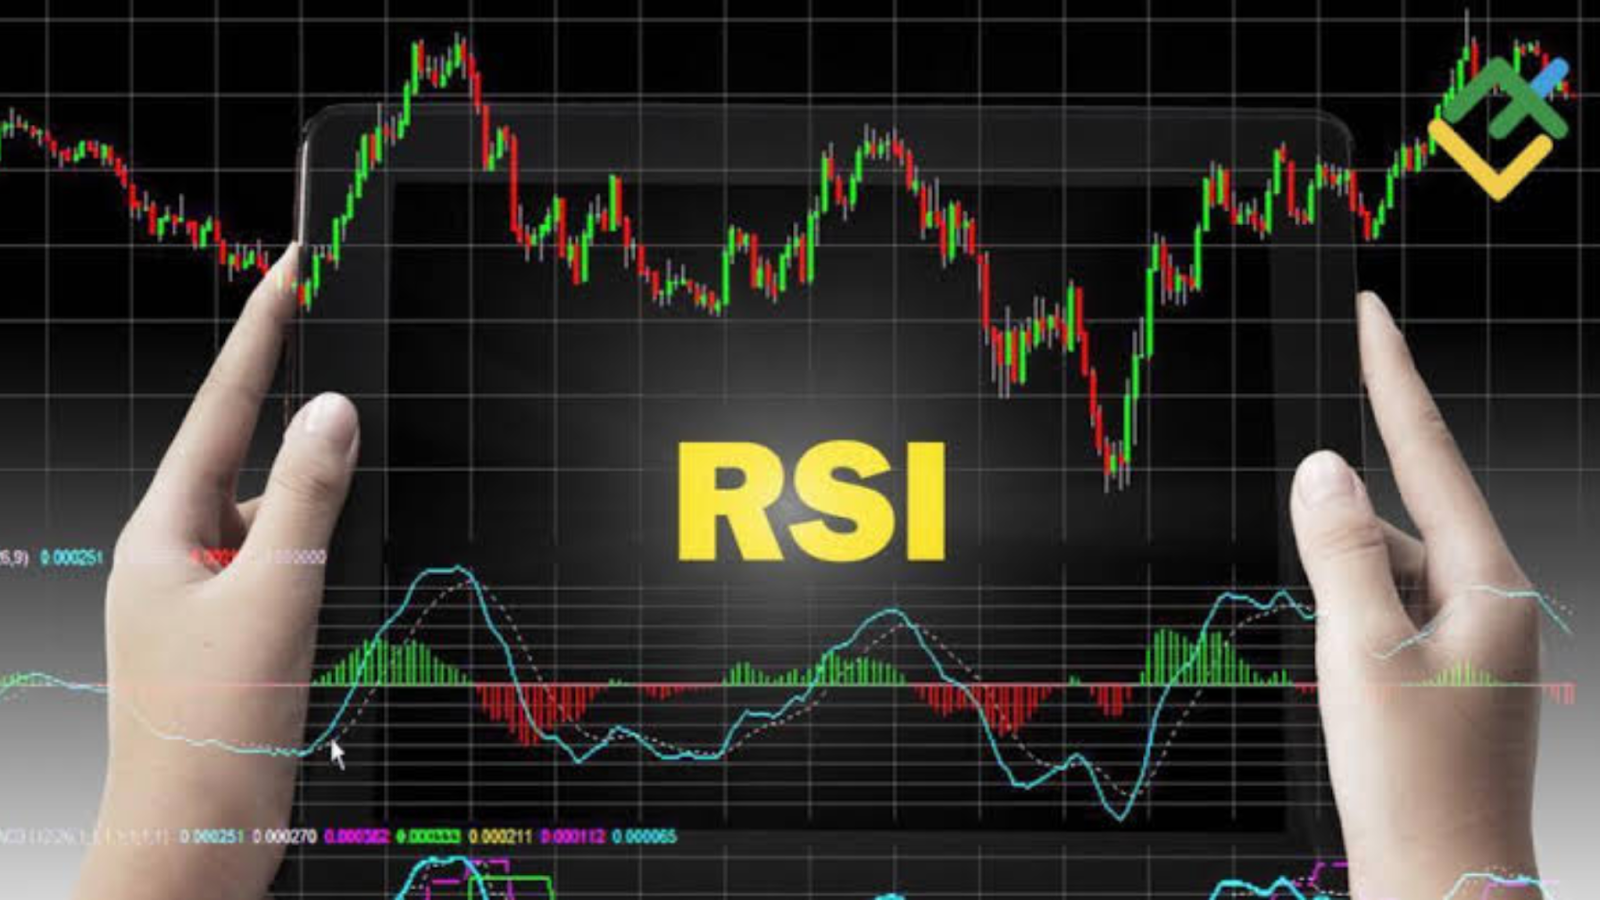
The RSI measures the speed and change of price movements. In detail, It oscillates between 0 and 100 and is used to identify overbought (above 70) or oversold (below 30) conditions, potentially signaling reversals.
MACD (Moving Average Convergence Divergence)
MACD shows the relationship between two moving averages of a cryptocurrency’s price. For example, it consists of a MACD line (the difference between the 12-day and 26-day EMA) and a signal line (often a 9-day EMA). Crossovers and divergences are used as buy or sell signals.
Bollinger Bands
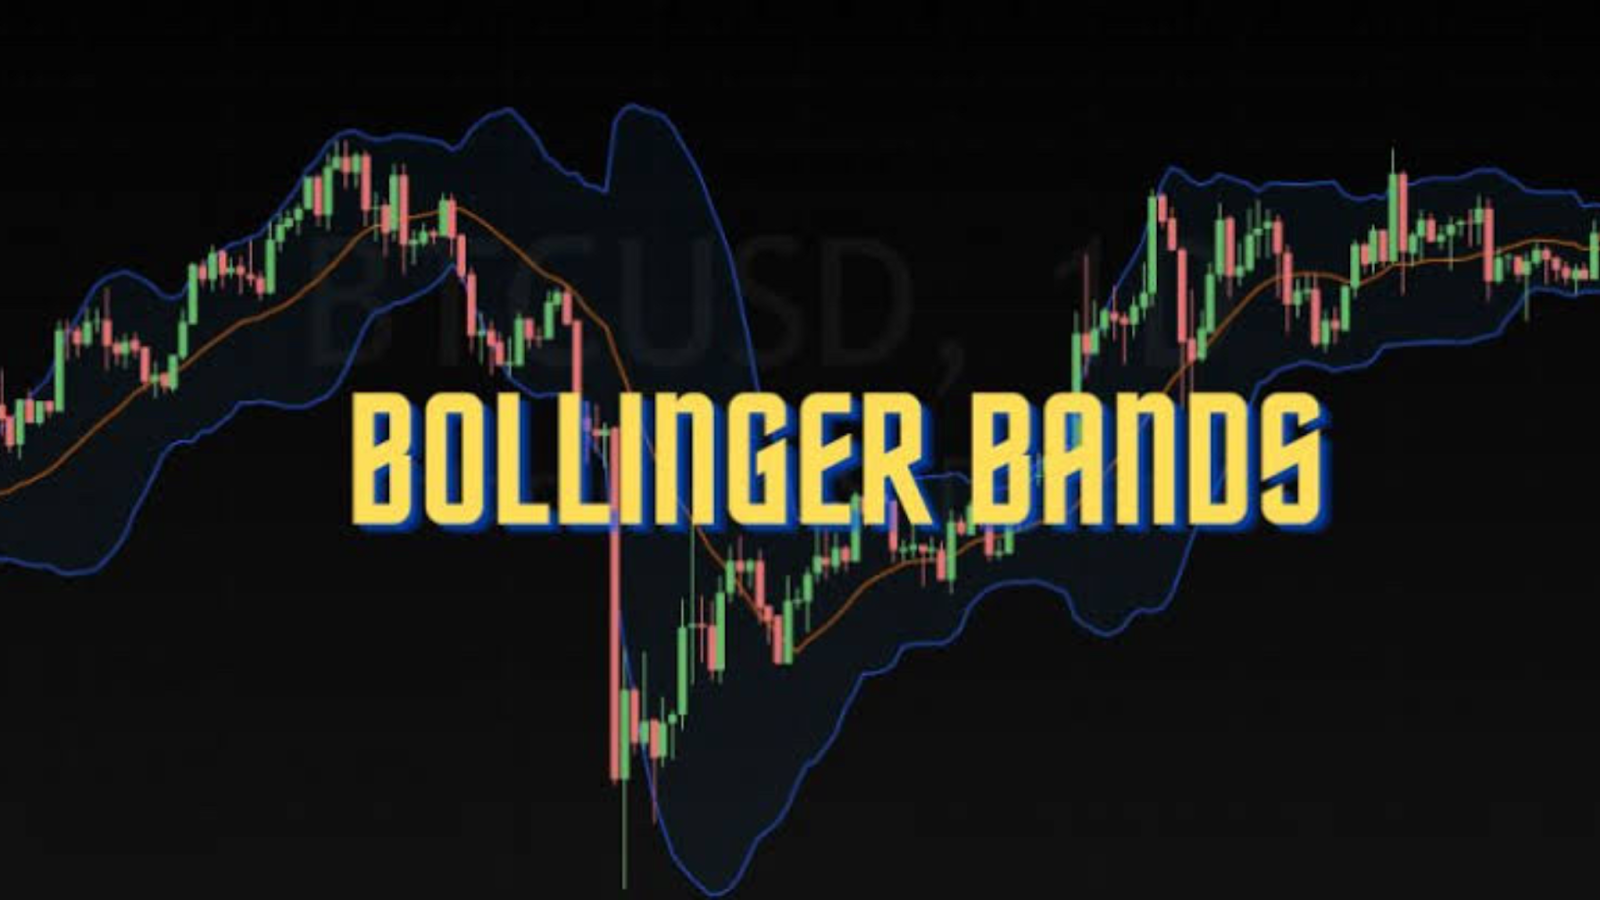
Bollinger Bands consist of a middle line (usually a 20-day moving average) and upper and lower bands that represent volatility. Therefore, traders use them to identify overbought or oversold conditions and potential price reversals when the price moves beyond the bands.
Ichimoku Cloud
The Ichimoku Cloud offers insights into support and resistance levels, trend direction, and potential future price movements. Components include the Kumo (cloud), Tenkan-sen (conversion line), and Kijun-sen (baseline).
Volume
Volume indicates the number of trades executed over a specific period. Increasing volume during price movements can confirm the strength of the trend, while decreasing volume may signal a trend reversal.
Average True Range (ATR)
ATR measures market volatility by calculating the average range between high and low prices over a specified period. Traders use ATR to set stop-loss and take-profit levels based on current market volatility.
On-Balance Volume (OBV)
OBV measures buying and selling pressure by adding volume on up days and subtracting volume on down days. Increasing OBV confirms an uptrend. On the contrary, decreasing OBV suggests a downtrend.
Fibonacci Retracement
Fibonacci retracement levels (e.g., 23.6%, 38.2%, 50%, 61.8%) are based on Fibonacci ratios and are used to identify potential support and resistance levels during price corrections or retracements.
ADX (Average Directional Index)
ADX measures the strength of a trend, regardless of its direction. Traders use ADX readings above 25 to confirm trend strength and below 20 to signal a weak or sideways trend.
Significance of Technical Analysis in Crypto Trading
Technical analysis is widely used in Crypto Trading. So are you curious about the reason why? We will provide you with some fundamental roles of Technical Analysis in Crypto Trading.
Price Prediction
Technical analysis helps traders forecast future price movements of cryptocurrencies by analyzing historical price data, chart patterns, and trends. By identifying patterns traders can make educated predictions about where prices may move next. For example, support and resistance levels, trend lines, and chart formations.
Market Timing
Technical analysis assists traders in determining the optimal timing for entering and exiting trades. By analyzing indicators such as moving averages, oscillators, and volume, traders can identify points of trend reversal or continuation. Consequently, it helps them time their trades more effectively to capitalize on price movements.
Risk Management
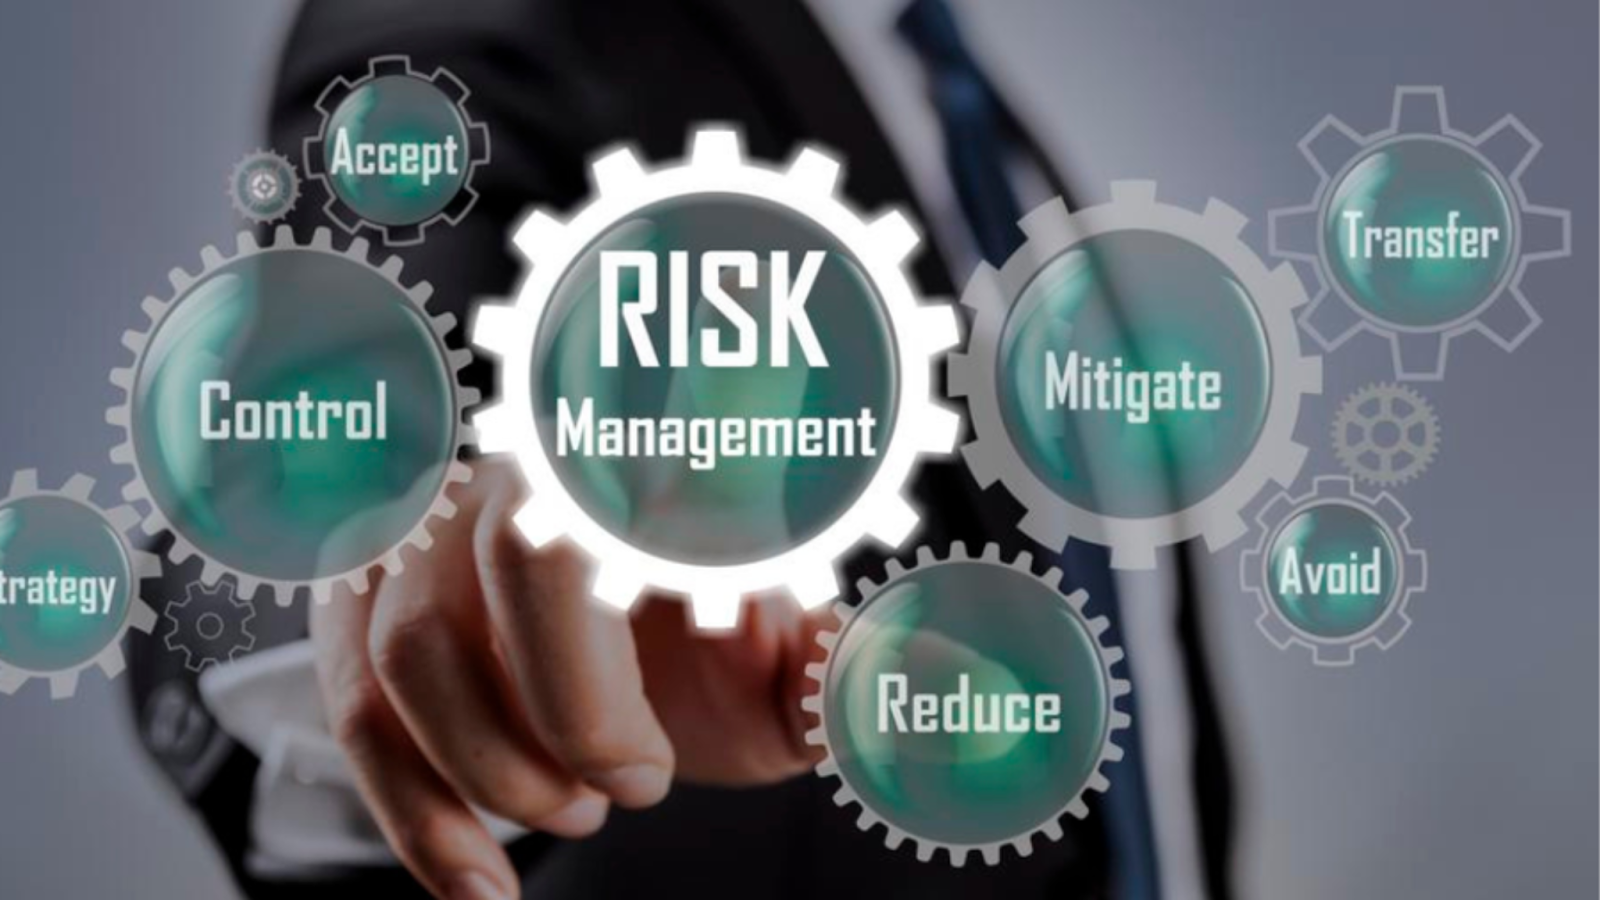
Technical analysis aids traders in managing risk by providing tools and techniques to set stop-loss orders, define risk levels, and determine position sizes. In other words, by incorporating risk management strategies into their trading plans, traders can mitigate potential losses and protect their capital in the highly volatile cryptocurrency markets.
Confirmation of Fundamental Analysis
While fundamental analysis focuses on evaluating the intrinsic value and underlying factors of cryptocurrencies, technical analysis can serve as a complementary tool to confirm or validate fundamental analysis conclusions. For instance, technical indicators may confirm a bullish trend identified through fundamental analysis, providing traders with added confidence in their trading decisions.
Identification of Trading Opportunities
Technical analysis helps traders identify potential trading opportunities in cryptocurrency markets. By continuously monitoring price charts and technical indicators, traders can spot patterns, trends, and chart formations that signal favorable entry points for long or short positions.
Market Sentiment Analysis
Technical analysis provides insights into market sentiment and investor psychology by analyzing price movements and trading patterns. Patterns such as bullish or bearish chart formations, volume spikes, and divergence between price and indicators can reveal shifts in market sentiment, helping traders gauge market sentiment and adjust their trading strategies accordingly.
Algorithmic Trading
Technical analysis is widely used in algorithmic trading strategies for cryptocurrencies. Automated trading algorithms can be programmed to analyze price data, execute trades based on predefined technical criteria, and manage positions according to specified risk parameters, allowing traders to capitalize on market opportunities with speed and efficiency.
Scalping and Day Trading
Technical analysis is particularly useful for short-term trading strategies such as scalping and day trading in cryptocurrency markets. Traders can leverage intraday price fluctuations, chart patterns, and technical indicators to execute multiple trades within a single trading session, aiming to profit from short-term price movements.
Conclusion
From a general perspective, technical analysis in crypto trading is a systematic approach to analyzing price data and market trends to make informed trading decisions. By studying historical price patterns, chart formations, technical indicators, and market statistics, traders aim to forecast future price movements and identify profitable trading opportunities in cryptocurrency markets.
About Herond Browser
Herond Browser is a Web browser that prioritizes users’ privacy by blocking ads and cookie trackers, while offering fast browsing speed and low bandwidth consumption. Herond Browser features two built-in key products:
- Herond Shield: an adblock and privacy protection tool;
- Herond Wallet: a multi-chain, non-custodial social wallet.
Herond aims at becoming the ultimate Web 2.5 solution that sets the ground to further accelerate the growth of Web 3.0, heading towards the future of mass adoption.
Join our Community!


Your writing has a way of resonating with me and making me feel understood Thank you for being a relatable and authentic voice
Your writing always provides such great value. Thanks for another excellent post!
Your blog post was really enjoyable to read, and I appreciate the effort you put into creating such great content. Keep up the great work!
Great insights, I really enjoyed reading your blog! Please check my post at https://mazkingin.com